How Economic Indicators Affect Trading Decisions
Impact of Economic Indicators on Trading
The financial markets are influenced by a myriad of factors, but none are as significant as economic indicators. These indicators serve as vital signs of the economy’s health and can dramatically affect trading decisions across various asset classes. In this article, we will delve into how economic indicators impact trading, the various types of indicators, and strategies traders can employ to make informed decisions.
Understanding Economic Indicators
Economic indicators are metrics that provide insights into the economic performance of a country. They help traders assess the current state of the economy and predict future movements. Economic indicators can be broadly classified into three categories:
Leading Indicators
Leading indicators are statistics that tend to change before the economy as a whole changes. They are used to forecast future economic activity.
- Examples:
- Stock market performance
- Consumer confidence index
- New orders for durable goods
Lagging Indicators
Lagging indicators change after the economy has already begun to follow a particular trend. They confirm trends and help traders understand past economic performance.
- Examples:
- Unemployment rate
- Gross Domestic Product (GDP)
- Corporate profits
Coincident Indicators
Coincident indicators occur in real-time with the economic performance. They are useful for identifying the current state of the economy.
- Examples:
- Industrial production
- Retail sales
- Personal income levels
The Connection Between Economic Indicators and Trading Decisions

Understanding economic indicators can have a profound impact on trading decisions. Here’s how:
Market Sentiment and Economic Indicators
Economic indicators greatly influence market sentiment. Positive indicators can lead to bullish market sentiment, while negative indicators can result in bearish sentiment. For instance, if the unemployment rate drops significantly, traders might view this as a sign that the economy is strengthening, leading them to buy stocks.
// Example: JavaScript function to interpret economic indicator data
function interpretIndicator(indicator, value) {
  if (indicator === "unemploymentRate" && value < 5) {
    return "Bullish Signal: Strong Job Market";
  } else if (indicator === "gdpGrowth" && value > 2) {
    return "Bullish Signal: Growing Economy";
  } else {
    return "Bearish Signal: Economic Concern";
  }
}

// Usage
console.log(interpretIndicator("unemploymentRate", 4)); // Bullish Signal: Strong Job Market
Trading Strategies Based on Economic Indicators
Traders often rely on various strategies based on economic indicators. Here are a few popular ones:
Fundamental Analysis
Traders using fundamental analysis will often examine economic reports to make decisions. For example, if the Federal Reserve signals an interest rate hike based on rising inflation, traders might short bonds or sell stocks in anticipation of economic slowdown.
Technical Analysis
Technical traders may incorporate economic indicators into their charts. For instance, if a particular stock shows a bearish divergence while the GDP data is positive, traders might take this as a potential sell signal.
Event-Driven Trading
Event-driven trading focuses on specific events, such as the release of a major economic report. Traders may buy or sell assets based on how they predict the market will react to the data.
Risk Management and Economic Indicators
Proper risk management is crucial when trading based on economic indicators. Here’s how traders can effectively manage risk:
- Stay Informed: Keep up-to-date with economic releases and understand their potential impact on the market.
- Diversify: Spread risk across different asset classes to mitigate losses.
- Use Stop-Loss Orders: Set stop-loss orders to limit potential losses if the market moves against your position.
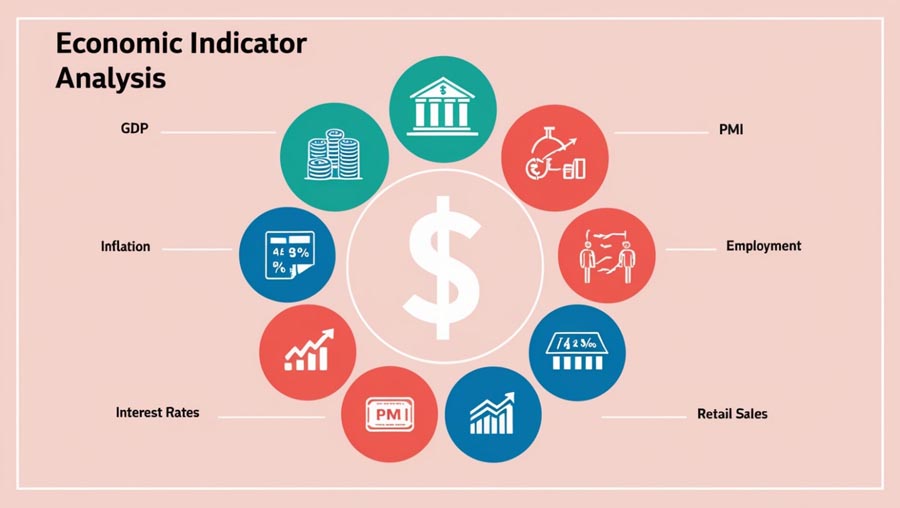
Key Economic Indicators to Watch

Each economic indicator can provide unique insights into the market. Here are some key indicators traders should pay attention to:
Non-Farm Payrolls (NFP)
Released monthly, NFP data provides insights into job creation. A higher-than-expected NFP number generally indicates a strong economy, while a lower number may signal economic weakness.
Consumer Price Index (CPI)
The CPI measures the average change over time in the prices paid by urban consumers for a market basket of consumer goods and services. Rising CPI indicates inflation, which may prompt central banks to raise interest rates.
Gross Domestic Product (GDP)
GDP represents the total value of goods and services produced in a country. A growing GDP is often a sign of economic health, while a declining GDP can signal recession.
Federal Reserve Interest Rate Decisions
The Federal Reserve’s decisions on interest rates can significantly impact the forex and stock markets. An interest rate hike often strengthens the US dollar, while a cut may weaken it.
How to Analyze Economic Indicators Effectively
Track Economic Calendars
Using an economic calendar can help traders stay informed about upcoming economic releases. This allows them to prepare their trading strategies accordingly.
- Example:
Compare Historical Data
Analyzing historical data for economic indicators can provide context for current readings. For example, if the current CPI stands at 3% but has consistently been around 2%, traders might interpret this as a warning sign of rising inflation.
Utilize Technical Analysis Tools
Traders can use technical analysis tools like charts, moving averages, and oscillators to spot trends before and after economic releases. This helps in making informed decisions.
# Example: Python code to plot economic indicators

import matplotlib.pyplot as plt
import pandas as pd
# Sample data

data = {
'Month': ['Jan', 'Feb', 'Mar', 'Apr', 'May'],
'CPI': [2.1, 2.3, 2.5, 2.4, 2.7],
'GDP_Growth': [1.5, 2.1, 2.2, 1.9, 2.4]
}
df = pd.DataFrame(data)
# Plotting

plt.plot(df['Month'], df['CPI'], label='CPI', marker='o')
plt.plot(df['Month'], df['GDP_Growth'], label='GDP Growth', marker='o')
plt.title('Economic Indicators Over Time')
plt.xlabel('Month')
plt.ylabel('Percentage')
plt.legend()
plt.grid()
plt.show()Conclusion

Economic indicators play a crucial role in shaping trading decisions. By understanding these indicators, traders can gain insights into market trends and make more informed decisions. Whether through fundamental analysis, technical analysis, or event-driven strategies, the effective use of economic indicators can ultimately lead to improved trading performance.